We recently brought a long-lived internal fork of appleboy/gorush [1] back up to date and moved its build from roughly Go 1.21.1 to Go 1.26. The upgrade was necessary. It was also a good excuse to test a claim that often slips into migration reports without evidence: “the new Go runtime made it faster.”
It did not-not with the default collector in the local hot paths I measured.
On the same gorush source and dependency graph, default Go 1.26.5 was 4.89% slower across five microbenchmarks by geomean and allocated 4.33% more bytes per operation. Rebuilding Go 1.26.5 with its legacy collector recovered almost all of the timing gap. That is not a reason to stay on an unsupported toolchain. It is a reason to separate maintenance work from performance claims.
Two upgrades were hiding in one deployment
The real production change was larger than a compiler switch. The fork had fallen behind upstream, internal interfaces had diverged, and dependencies needed attention. Comparing the old and new production binaries would therefore answer a useful operational question-“is the whole release healthy?”-but not a narrower one: “what did the Go toolchain change?”
The production repository is private, so I built a public proxy instead. I used gorush commit d0e1045 [2]
, whose go.mod declares Go 1.21, and compiled the exact same tree twice:
go1.21.1 linux/amd64, the likely old production baseline;go1.26.5 linux/amd64, the current patched 1.26 toolchain at the time of testing.
The old production image digest is no longer available, so “1.21.1” is a reconstructed baseline, not a forensic claim. The benchmark itself is exact and reproducible.
What I measured
I deliberately excluded FCM and APNs network calls. Provider latency would swamp microsecond-scale runtime differences and turn the test into an internet benchmark.
The suite covers work gorush performs before a notification reaches the network:
- encoding a 100-token notification for the queue;
- decoding the same queue payload;
- building an FCM message for one recipient;
- building FCM messages for 100 recipients;
- building an APNs payload.
The payload includes nested custom data, a title, body, image, sound, badge, expiration, and background-notification fields. The benchmark source is published with this article [3] .
Both builds ran in Debian Bookworm containers on the same Intel Core Ultra 7 255H. I pinned the containers to six performance cores, set GOMAXPROCS=6, disabled cgo, and ran no benchmarks in parallel.
Each toolchain produced 30 samples per benchmark at 500 ms per sample. Runs were interleaved in ten-sample batches (old → new → new → old → old → new) to reduce ordering and thermal bias. benchstat [4]
reports medians, 95% confidence ranges, and non-parametric A/B comparisons. I use medians rather than arithmetic means because they are less sensitive to scheduler noise and occasional frequency drops on a laptop.
Results
Lower ns/op is better. Every reported timing difference in Table 1 passed benchstat’s default significance threshold of p < 0.05.
Table 1. Same-source gorush benchmark results on Go 1.21.1 and Go 1.26.5.
| Benchmark | Go 1.21.1 | Go 1.26.5 | Change |
|---|---|---|---|
| Queue encode | 7.620 µs | 7.709 µs | +1.17% |
| Queue decode | 11.68 µs | 12.16 µs | +4.12% |
| FCM, one recipient | 2.543 µs | 2.578 µs | +1.36% |
| FCM, 100 recipients | 11.26 µs | 12.38 µs | +9.94% |
| APNs payload | 752.3 ns | 813.9 ns | +8.18% |
| Geomean | 4.534 µs | 4.756 µs | +4.89% |
The memory counters in Table 2 moved in the same direction.
Table 2. Geometric means of allocation metrics across the five benchmark paths.
| Geomean | Go 1.21.1 | Go 1.26.5 | Change |
|---|---|---|---|
| Bytes per operation | 3.651 KiB | 3.809 KiB | +4.33% |
| Allocations per operation | 38.38 | 39.98 | +4.17% |
Queue encoding is the clearest allocation lead: it went from 23 to 27 allocations per operation and from 3.611 KiB to 3.989 KiB. FCM construction added one allocation. APNs construction kept the same six allocations and 936 bytes while still taking 8.18% longer.
These measurements identify a regression in this workload; by themselves they do not identify its root cause. The stable changes in allocation counts point toward code generation, inlining, or escape-analysis decisions worth investigating. A separate collector A/B test narrows down the timing difference.
What about Green Tea GC?
Go 1.26 enables the Green Tea collector by default [5] . The release notes estimate a 10–40% reduction in garbage-collection overhead for GC-heavy real-world programs and describe additional gains on recent amd64 processors. The compiler can also place more slice backing stores on the stack.
Neither statement promises that every operation will become faster. “GC overhead” is only one part of wall-clock time, and a short payload-construction benchmark is not a steady-state push service. This suite also allocated more under the new toolchain, so the release-note headline cannot substitute for a measurement of this code.
Production signals
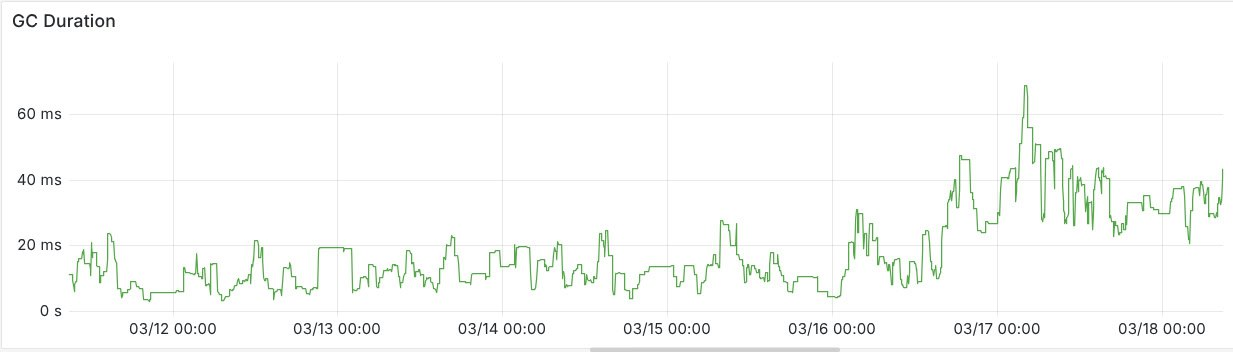
The first signal came from an external production report published by AterCattus. After that service moved from Go 1.25 to Go 1.26, its go_gc_duration_seconds graph shifted from roughly 5–20 ms into the 20–50 ms range, with a peak near 70 ms. The author reported GOGC=20, about 2.5 GB of memory, tens of millions of heap objects, and a collection roughly every four seconds, with no other visible change in CPU or memory consumption. The upper-duration view is reproduced in Pic. 1, and the original discussion is public [6]
.
Our own production signal came from a different service and a different aggregation. We deployed its Go 1.26 build on May 25, 2026. Pic. 2 plots summary sum / count, or average pause duration, with the rollout point marked at May 25, 10:30. The average remained in microseconds, but taller and more frequent bursts appeared after the marker.
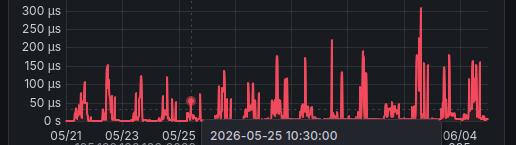
These panels come from different services and use different aggregations and time windows, so their values should not be compared directly. Both are rollout signals rather than controlled A/B measurements, and neither panel measures total GC CPU.
The Prometheus collector defines that metric as a summary of GC pause duration [7] , not GC CPU time. Pic. 1 says that pauses got longer for the externally reported service; it does not say that the collector consumed more total CPU. Its author did not consider the extra 20–40 ms every few seconds operationally painful. Our observation in Pic. 2 was a separate reason to test the collector on this workload.
Isolating the collector
Go 1.26 still allows Green Tea to be disabled at build time with GOEXPERIMENT=nogreenteagc. I rebuilt the same Go 1.26.5 benchmark with that single change and repeated the full 30-sample interleaved run.
This was a separate A/B run, so the default-build medians in Table 3 differ slightly from Table 1.
Table 3. Controlled collector A/B on Go 1.26.5. Negative changes favor the legacy collector.
| Benchmark | Green Tea | Legacy GC | Change |
|---|---|---|---|
| Queue encode | 7.648 µs | 7.844 µs | no significant change |
| Queue decode | 12.19 µs | 11.64 µs | −4.50% |
| FCM, one recipient | 2.550 µs | 2.457 µs | −3.63% |
| FCM, 100 recipients | 12.26 µs | 11.08 µs | −9.60% |
| APNs payload | 811.4 ns | 751.8 ns | −7.35% |
| Geomean | 4.729 µs | 4.512 µs | −4.59% |
Allocation counts were identical and bytes per operation differed by only −0.01% geomean. As a cross-run reference, Go 1.26.5 plus the legacy collector was effectively even with Go 1.21.1 at −0.50% geomean, although individual paths moved in both directions. That last number was not a third interleaved A/B and should be read as a consistency check, not a new precision claim.
This isolates the collector implementation much more tightly than the original version comparison: Green Tea accounts for most of the timing regression in this microbenchmark, while it does not explain the extra allocations produced by the Go 1.26.5 build. The full benchstat summaries are available alongside the source [8]
.
Letting it run
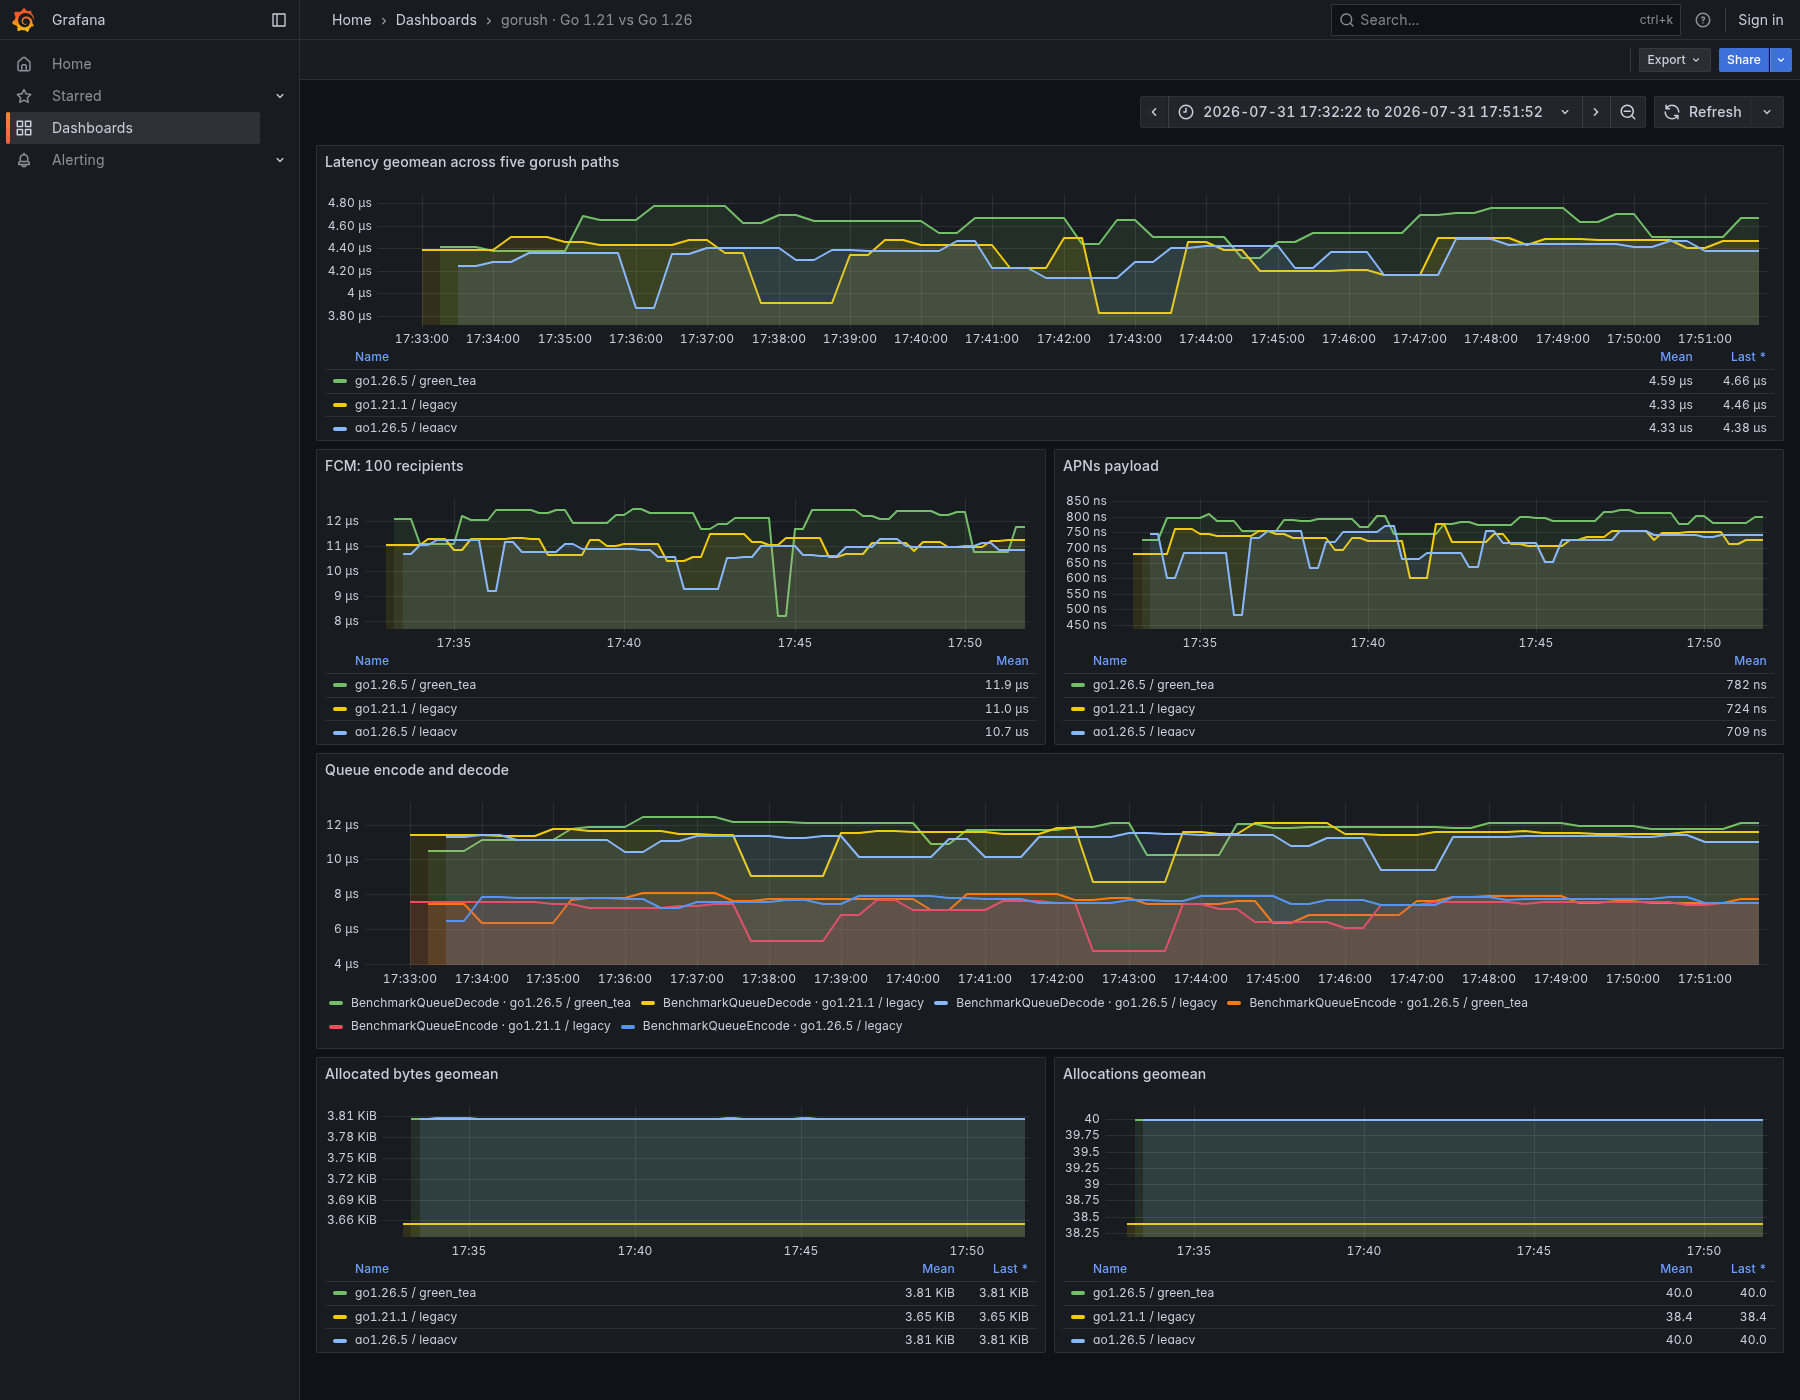
The 30-sample result was consistent, but it still described short 500 ms windows. I followed it with an 18-minute stability run using the same source, cores, and containers, with the laptop on AC power throughout. Each configuration completed 24 rounds; every round ran all five benchmarks for two seconds each. The three configurations rotated through every position in the order, so none of them consistently inherited the coolest or hottest slot.
For each round I calculated the geomean across the five paths, then summarized the 24 round-level values in Table 4. This is a separate descriptive run, not a replacement for the benchstat significance test above.
Table 4. Median and interquartile range of the 24 round-level latency geomeans.
| Configuration | Median | IQR |
|---|---|---|
| Go 1.21.1, legacy GC | 4.429 µs | 4.310–4.472 µs |
| Go 1.26.5, Green Tea | 4.640 µs | 4.502–4.688 µs |
| Go 1.26.5, legacy GC | 4.371 µs | 4.268–4.411 µs |
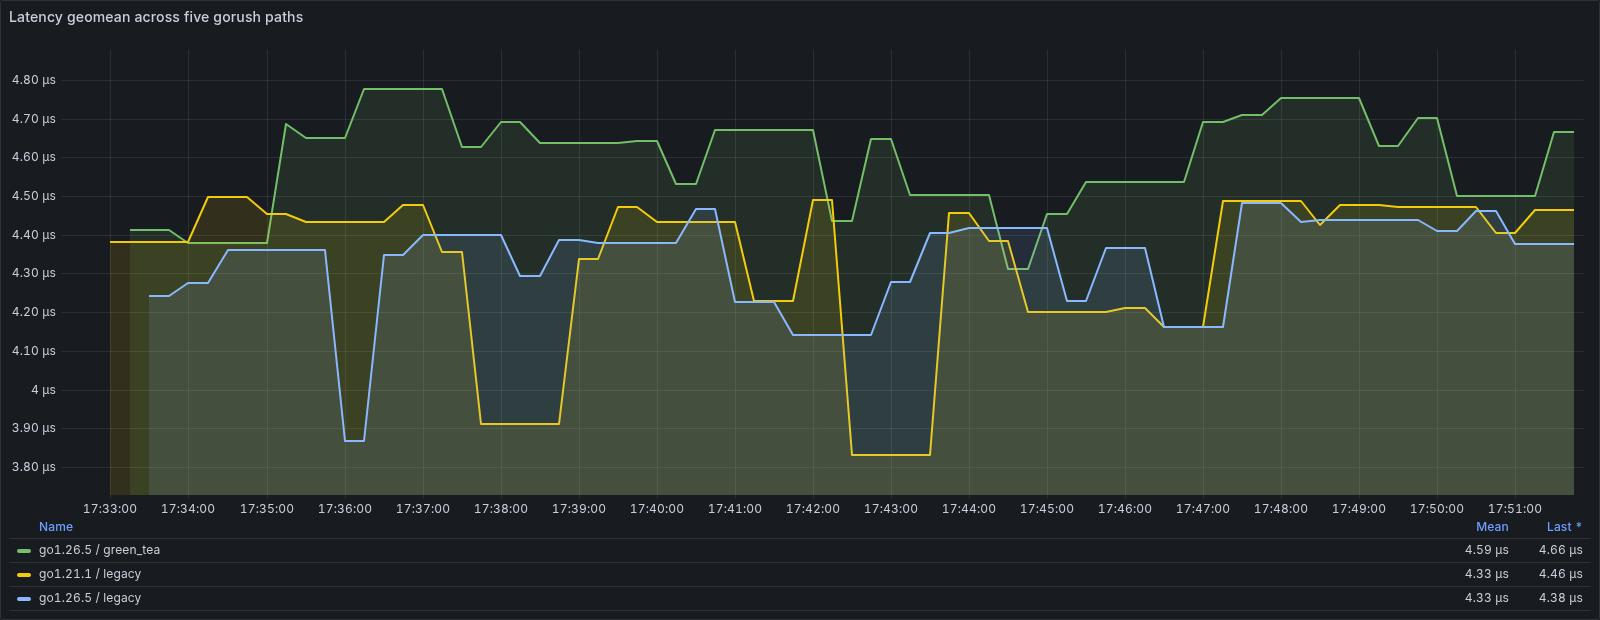
Green Tea ended 4.75% behind Go 1.21.1 and 6.13% behind the Go 1.26.5 legacy collector by median round-level geomean. Go 1.26.5 with the legacy collector was 1.30% ahead of Go 1.21.1. The absolute timing moved with laptop conditions, while the broad relationship survived a much longer window, as Pic. 3 makes visible.
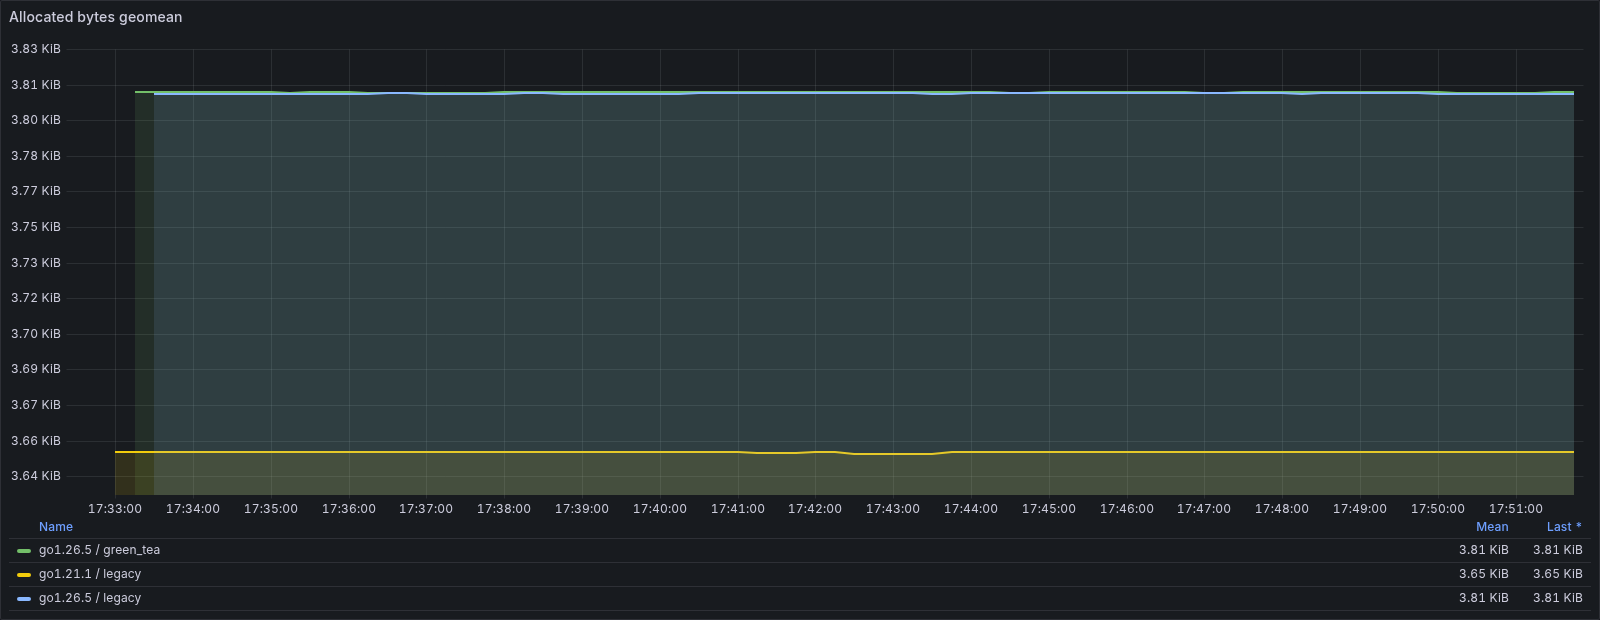
The allocation chart in Pic. 4 tells a different and much quieter story. Both Go 1.26.5 builds overlap at about 3.81 KiB/op geomean, while Go 1.21.1 stays near 3.65 KiB/op. Changing the collector moved time, not the compiler’s allocation decisions.
The full rendered Grafana dashboard [9] , raw 360 measurements [10] , dashboard provisioning, and runner are kept with the article. The raw CSV is the evidence; the charts are a readable projection of it.
The correct next step is an allocation profile and compiler diagnostics around the changed paths, followed by a service-level load test. Disabling a new collector in production because of one microbenchmark would be cargo cult in the opposite direction. A canary A/B between default Go 1.26.5 and nogreenteagc, under the same traffic, would be evidence.
Why the upgrade was still correct
Go supports a major release only until two newer major versions exist. By the time Go 1.26 shipped, Go 1.21 had been outside the supported release window for a long time [11] . Go 1.26.5 itself includes security and runtime fixes over 1.26.0.
That makes the production decision straightforward: keep the supported toolchain. A single-digit CPU regression in isolated local work does not outweigh security fixes, current dependencies, and the ability to take the next update without another multi-year migration.
It does change how I would validate the rollout. I would compare canaries on:
- API latency at p50, p95, and p99;
- queue depth and queue wait time during bursts;
- allocation rate,
/gc/pauses:seconds,/cpu/classes/gc/total:cpu-seconds, and RSS; - worker throughput with provider calls replaced by a controlled local stub;
- end-to-end delivery latency, reported separately because provider latency dominates it.
If production profiles show queue serialization or payload construction consuming meaningful CPU, the extra allocations are actionable. If the service spends nearly all its time waiting for FCM and APNs, they are an interesting compiler regression with little operational impact.
Reproduce it
Copy the benchmark file [3]
into notify/benchmark_test.go at the selected gorush commit. The function below runs one ten-sample batch; invoke it in the interleaved order described above and append each version to its own file.
bench() {
    version="$1"
    docker run --rm --cpuset-cpus=0-5 \
        -e GOMAXPROCS=6 \
        -e GOTOOLCHAIN=local \
        -e CGO_ENABLED=0 \
        -v "$PWD:/src:ro" \
        -w /src \
        "golang:${version}-bookworm" \
        go test -tags sqlite ./notify \
            -run '^$' \
            -bench '^(BenchmarkQueue|BenchmarkBuild)' \
            -benchmem \
            -count=10 \
            -benchtime=500ms \
            -cpu=6
}
Then compare the two 30-sample files:
go run golang.org/x/perf/cmd/benchstat@latest go1.21.1.txt go1.26.5.txt
The lesson is not that Go 1.21 is faster. The lesson is that runtime upgrades buy support and security by default; performance still has to earn its sentence in the release notes.
References
[1] appleboy/gorush: a push notification server written in Go. GitHub repository.
[2] appleboy/gorush, commit d0e1045. GitHub.
[3] Igor Polyakov. gorush Go 1.21.1 versus Go 1.26.5 benchmark source.
[4] The Go Authors. benchstat package documentation.
[5] The Go Authors. Go 1.26 Release Notes: Runtime.
[6] AterCattus was here. Production GC observation and discussion, March 19, 2026. Telegram.
[7] Prometheus Authors. Definition of go_gc_duration_seconds in client_golang v1.19.0.
[8] Igor Polyakov. Full benchstat output for the controlled benchmark runs.
[9] Igor Polyakov. Grafana dashboard for the 18-minute gorush stability run.
[10] Igor Polyakov. Raw data: 360 measurements from the gorush stability run.